I wanted to try my new Prometheus setup with some useful data, and since I want to learn how to use Prometheus, I thought it would be fun and useful to do this.
In case you're not familiar with it, Prometheus is a server app that gathers metrics in a database. Metrics that are then displayed in some specialized web app such as Grafana (the most popular for this usage).
I won't go into details of how to install prometheus, since this can be found in many places on the Web.
The JavaScript
Here's the JS code I've put on all my pages (in all.js at the top):
const worker = new Worker('/javascripts/worker.js');
worker.postMessage({ page: window.location.pathname });
and here's the content of my worker.js:
self.onmessage = async (e) => {
    const { page } = e.data;
    await fetch('/prom_collector.php', {
        method: 'POST',
        headers: { 'Content-Type': 'application/json' },
        body: JSON.stringify({ url: page }),
        keepalive: true, // survives page unload
    });
};
BTW, why use JavaScript and not the backend (PHP) directly?
Because as you may know, we live in an era where bots who crawl web pages are legion. And those bots don't normally operate within the context of a (costly) headless browser. Some do -- like Googlebot -- but at the time of writing this, they don't execute workers, because that might be even costlier, for marginal gains.
In short, I want metrics about real humans visiting my site. Otherwise I would've used my Apache logs.
The PHP
Here's the PHP code (prom_collector.php) that's triggered by the worker.js:
<?php
/*
 * This page is requested by the javascript on tracked pages
 */

$db = new PDO('sqlite:' . __DIR__ . '/pageviews.sqlite3');

$json = file_get_contents('php://input');
$data = json_decode($json, false);

// Only execute this when deploying to a new site:
// $db->exec('CREATE TABLE IF NOT EXISTS views (page TEXT PRIMARY KEY, count INTEGER DEFAULT 0)');

$page = $data->url ?? 'unknown';
if ($page === 'unknown') {
  die("unknown page");
}
$stmt = $db->prepare('INSERT INTO views(page, count) VALUES(?, 1)
                      ON CONFLICT(page) DO UPDATE SET count = count + 1');
$stmt->execute([$page]);

echo json_encode(['ok' => true]);
And here's the code for the metrics.php page:
<?php
/*
 * Prometheus scrapes this page
 */

$db = new PDO('sqlite:' . __DIR__ . '/pageviews.sqlite3');
$rows = $db->query('SELECT page, count FROM views')->fetchAll(PDO::FETCH_ASSOC);

header('Content-Type: text/plain; version=0.0.4');

// Begin prometheus-formatted document:
echo "# HELP page_views_total Number of times a page was accessed\n";
echo "# TYPE page_views_total counter\n";
foreach ($rows as $row) {
    $safe = addslashes($row['page']);
    echo "page_views_total{page=\"{$safe}\"} {$row['count']}\n";
}
So, for each page that received at least one visit, we display the number of visits it got so far.
Prometheus
Finally, here's the config that I added to my prometheus.yml, under
scrape_config:
  - job_name: 'juliendesrosiers_com'
    scrape_interval: 60s
    static_configs:
      - targets: ['juliendesrosiers.com']
    metrics_path: '/metrics.php'
Then, restart prometheus.
The rest is ClickOps:
- login to your grafana
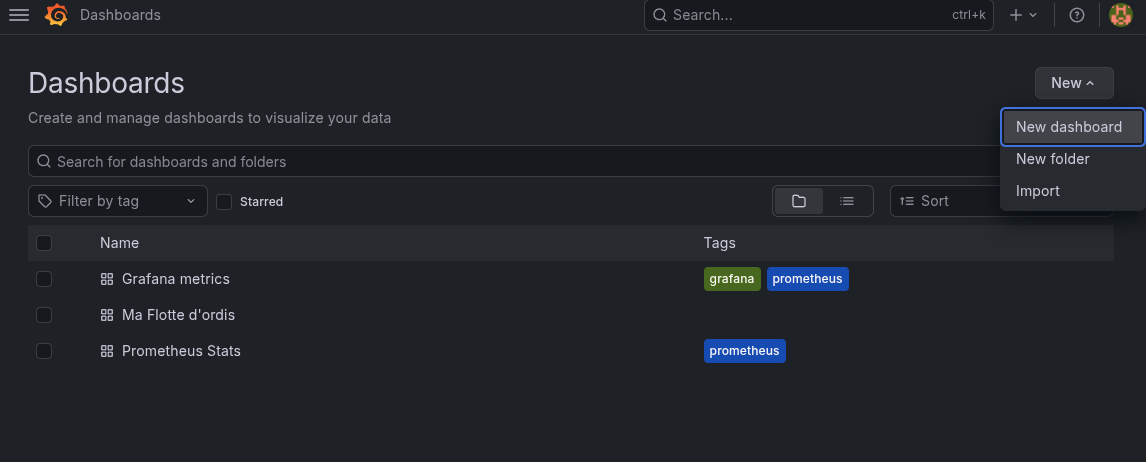
- go to "Dashboards", then create a new dashboard -- if needed:
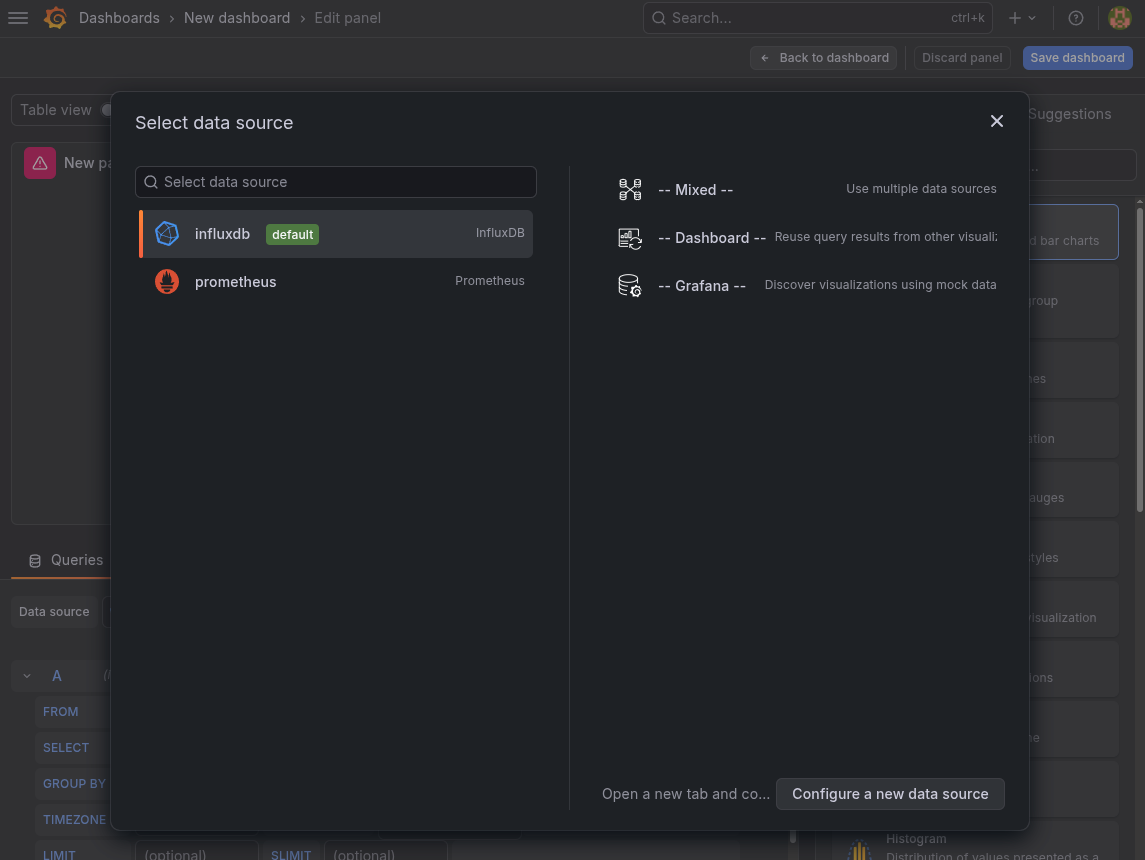
- click "Add visualization":

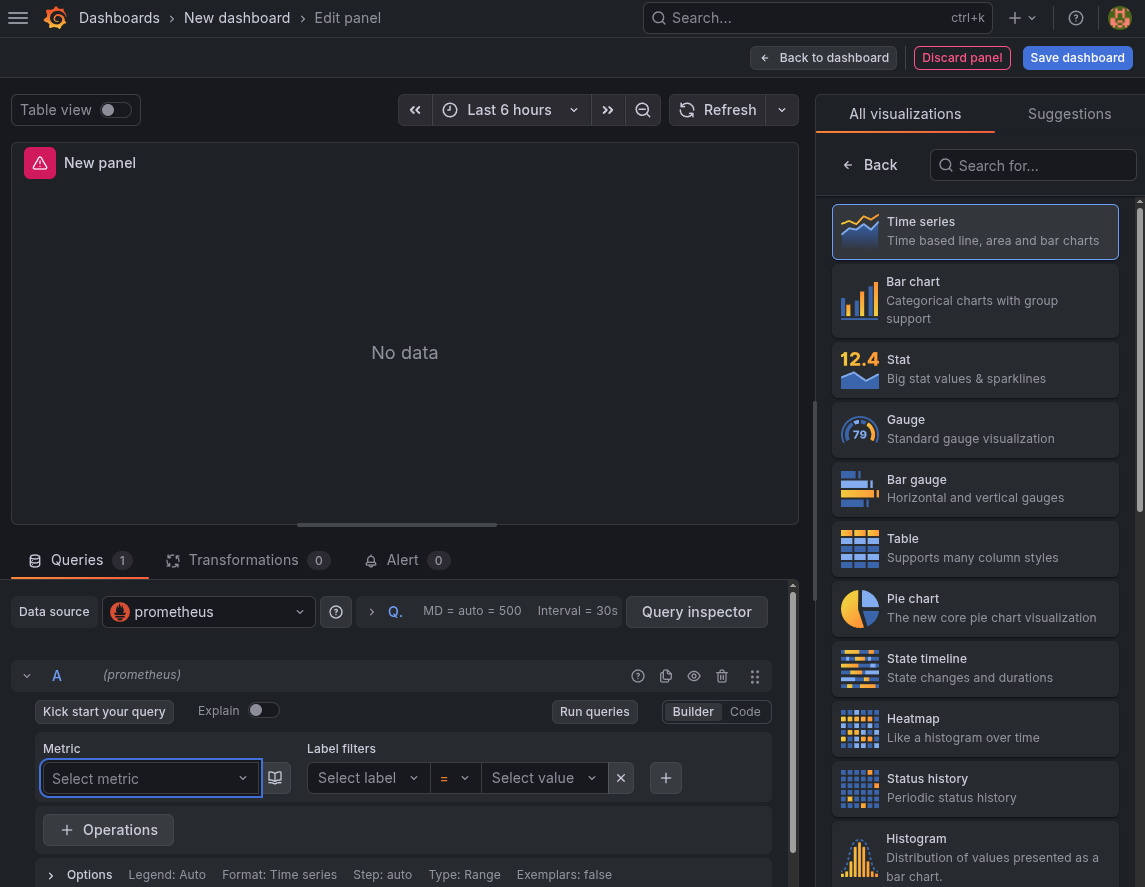
- choose "Prometheus" as the data source:
- now, scroll down and click "Select metric":
- you should find the
page_views_total(seemetrics.php):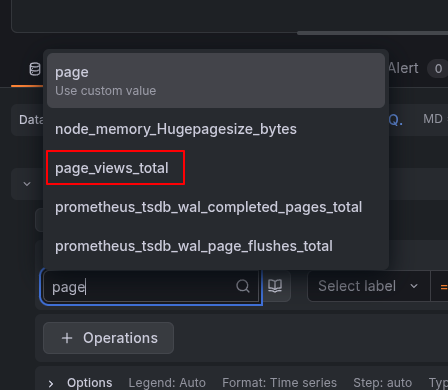
- select a label, if you want to group only for one site:
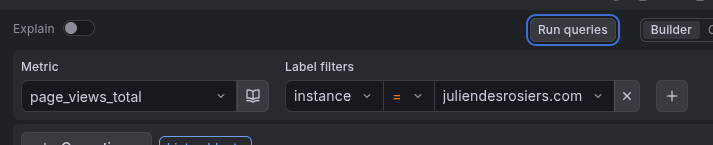
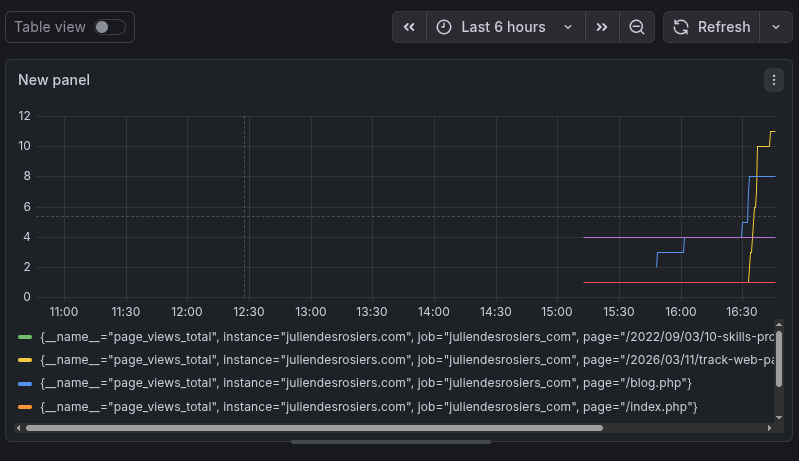
- you can try the query by clicking "Run query", and if you're like me, you
have many page in your site. So each of those get assigned its own color:
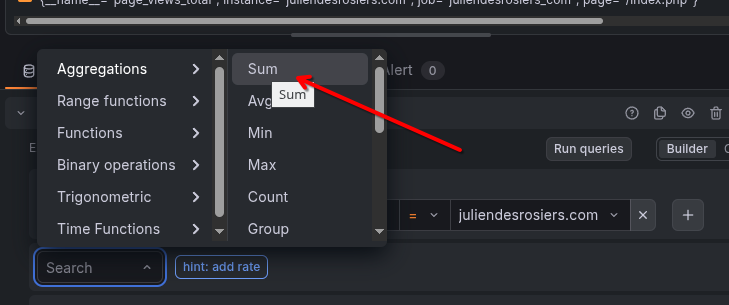
- which of course should get crowdy pretty quickly. so let's add another
operation, to aggregate those into only one metric (the total for all the
pages):
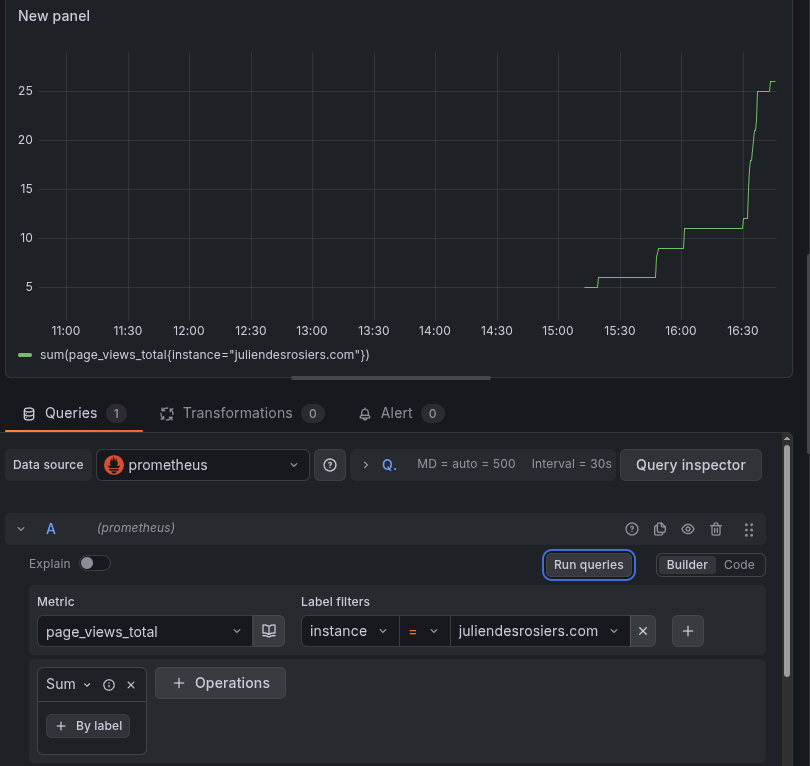
- "Run query" again, and you should now see something like this:
- Make sure you save your work...
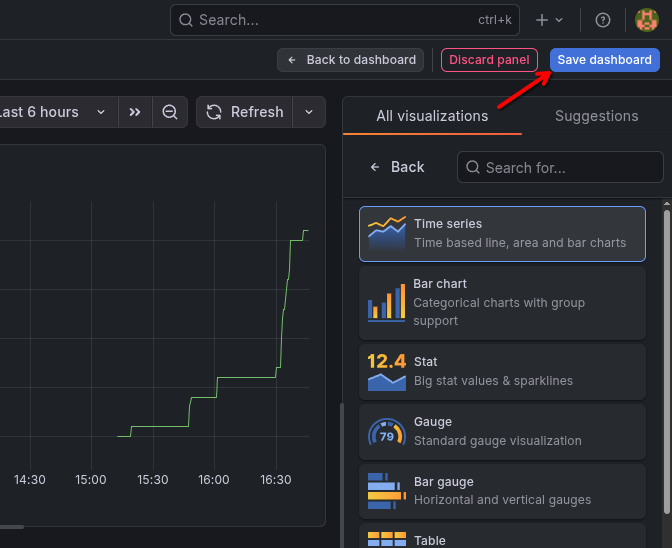
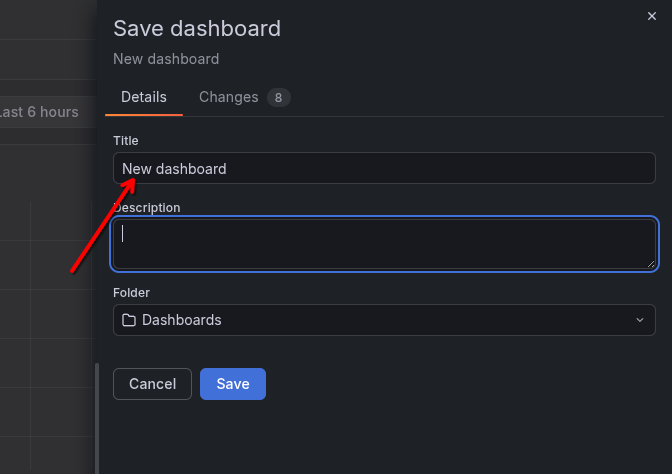
- Take the time to give a proper name for this dashboard:
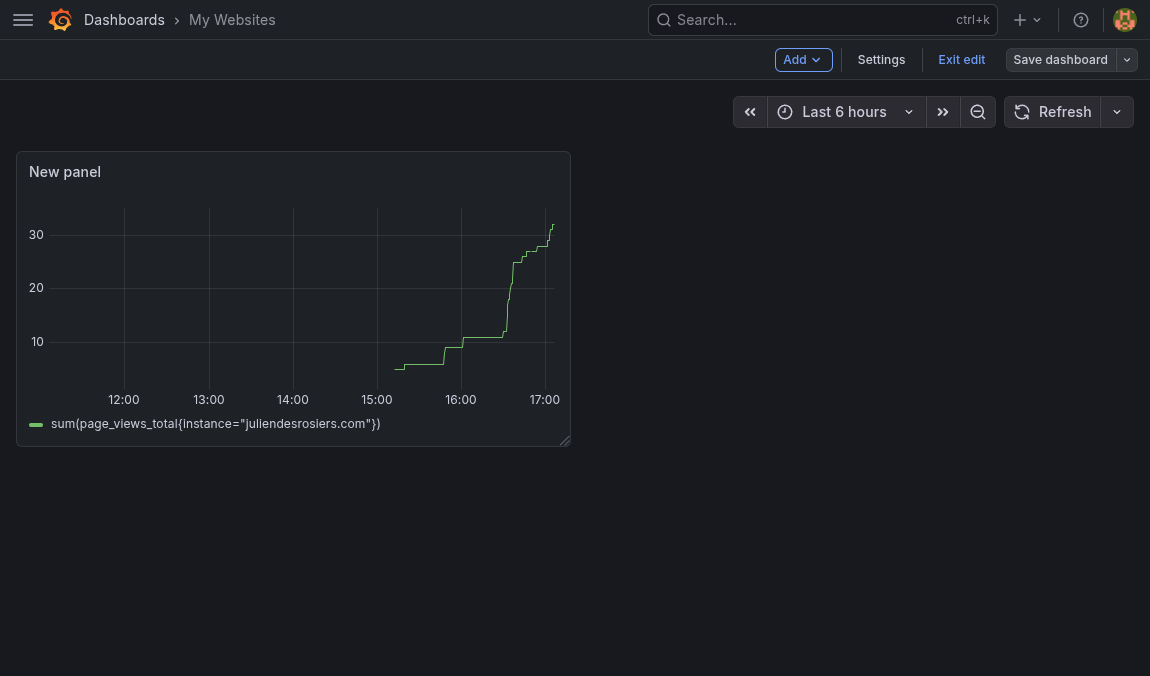
- Now go back to your dashboard view and take a look. Nice!:
Downside of this approach
- As it is right now, it won't allow much more granularity, when you compare to tools meant for tracking visits, like Google Analytics. For example, adding viewport size and user agent wouldn't scale well here.
- I'm hosting Prometheus myself, so it's more expensive than using Google's solution. (Which uses Cookies, which would necessitate adding one of those pesky cookie acceptance popups)
